
 How to resolve AdBlock issue?
 Global Barometers show world economy slowdown running its course
Report by the KOF Swiss Economic Institute and Fundação Getulio Vargas, Brazil
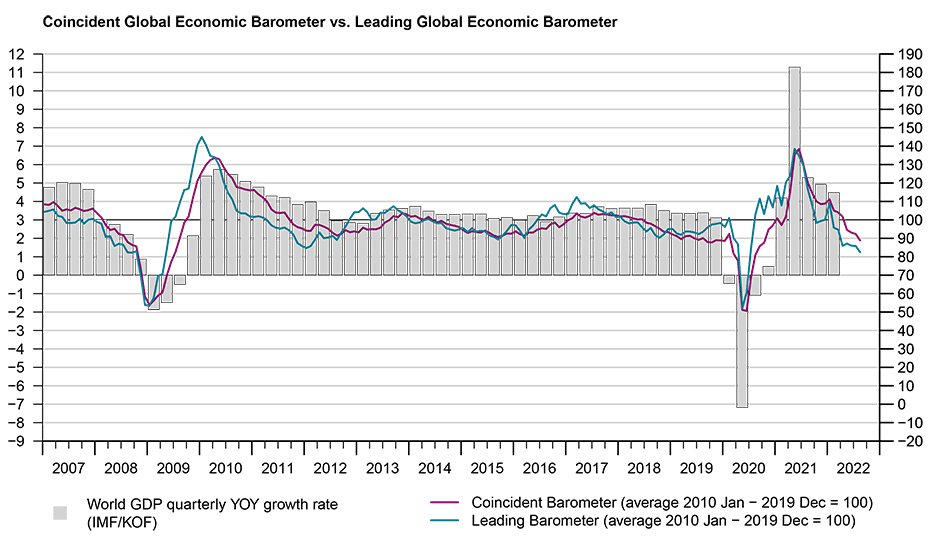
THE Global Barometers fell once again in August, signalling a slowdown in world growth for this quarter. The Coincident Barometer decreased for the seventh month in a row, while the Leading Barometer dropped again after remaining stable in the previous month.
The results reflect a bleak perspective for world economic growth in the coming months.
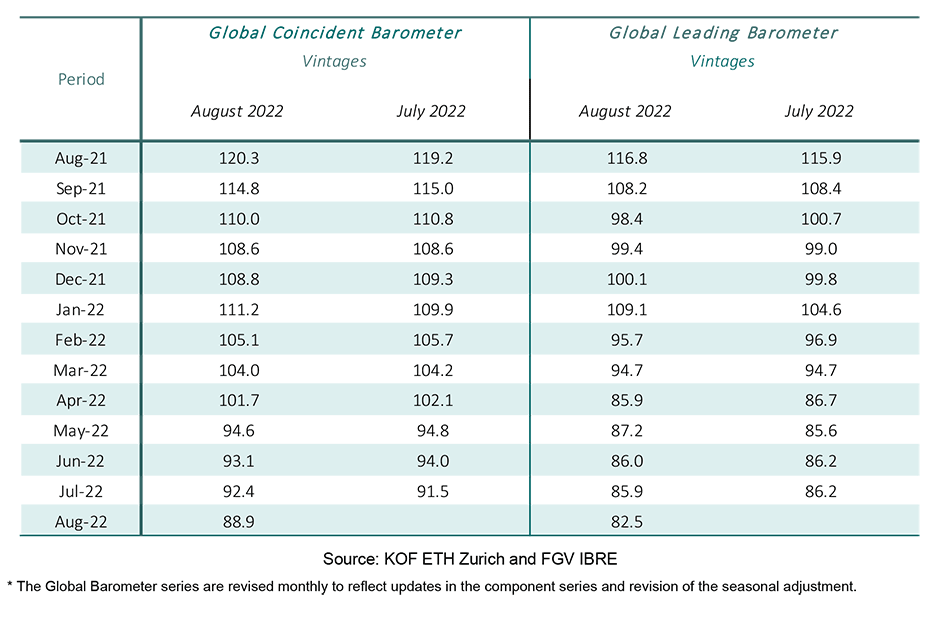
The Coincident Global Economic Barometer declined 3.5 points in August 2022, to 88.9 points, accumulating a 22.3-point decrease since February this year.
The Leading Global Economic Barometer dropped 3.4 points for the month, reaching 82.5 points. Although the levels are well above those of the worst moments of the crises of 2008-09 and 2020, both indicators are now at levels that have only been reached during these two global recessions of the 21st century.
The results are spread across the different regions of the world, with a more intense fall in the Asia, Pacific, and Africa regions.
“Unemployment rates in the European Union, the United Kingdom and the United States have reached their lowest levels of this century, indicating booming or at least strongly recovering economies,” KOF Swiss Economic Institute director, Jan-Egbert Sturm said.
“But the global barometers, now at their lowest levels outside the financial and pandemic crises, paint a rather gloomy outlook for the world economy. The war in Ukraine, political tensions in China and still exceptionally high inflation rates in many Western economies create an environment with many unknowns.
“With the fiscal powder keg de facto empty and monetary policy increasingly focused on fighting inflation, this is unsettling for both consumers and producers,” Professor Sturm said.
Coincident Barometer – regions and sectors
In August, all regions contributed to the negative result of the Coincident Barometer. The largest contribution comes from the Asia, Pacific, and Africa region, with -2.5 points, while Europe contributed -0.9 points and the Western Hemisphere -0.1 points.
The decrease in the global indicator was partly caused by supply restrictions related to the war in Eastern Europe and the economic slowdown in Asia, which had shown signs of recovery in the previous two months after the restrictions on mobility adopted in China as a measure to combat an outbreak of Covid-19 were lifted.
The new decline in the coincident indicator for the region suggested that the apparent recovery may have been temporary. The graph below illustrates the contribution of each region to the deviation of the Coincident Barometer from the historical mean of 100 points.
Among the coincident sector indicators, the decline is spread across all of them. The negative standout for the month was the Construction sector, which dropped 4.0 points and has now the lowest level among all sectors (71.5 points). With this result, all the indicators move further below the historical mean of 100 points, with the Construction sector being the most distant (28.5 points below) and Industry the least distant (9.5 points below).
Leading Barometer – regions and sectors
The Leading Global Barometer leads the world economic growth rate cycle by three to six months on average. In August, the global indicator dropped 3.4 points to 82.5 points, the lowest level since June 2020 (60.7 pts).
As with the Coincident Barometer, the Asia, Pacific, and Africa regions contributed most to the decline, with -1.9 points. Europe also contributed negatively for the third consecutive month (-1.4 points), while the indicator for the Western Hemisphere remains stable this time after three months of negative contributions.
Global growth expectations for 2022 have been worsening in light of, among other factors, the ongoing conflict between Ukraine and Russia, inflationary pressures and the associated adoption of more restrictive monetary policies in various countries.
In August 2022, four of the five Leading indicator sectors were declining. Only the indicator for Trade increased this month after three consecutive falls.
All the indicators remain far below the historical mean of 100 points, especially Construction, which is 24.4 points below neutral. With 13.6 points, Trade is the least distant from the historical mean.
What are the Global Economic Barometers?
The Global Economic Barometers are a system of indicators enabling timely analysis of global economic development. They represent a collaboration between the KOF Swiss Economic Institute of the ETH Zurich in Switzerland and Fundação Getulio Vargas (FGV), based in Rio de Janeiro, Brazil. The system consists of two composite indicators, the Coincident Barometer and the Leading Barometer. The Coincident Barometer reflects the current state of economic activity, while the Leading Barometer provides a cyclical signal roughly six months ahead of current economic developments.
The two Barometers comprise the results of economic tendency surveys conducted in more than 50 countries with the aim of achieving the broadest possible global coverage. The advantages of economic tendency surveys are that their results are usually readily available and are not substantially revised after first publication.
The Coincident Barometer includes more than 1000 different time series, while the Leading Barometer consists of over 600 time series. Cross-correlation analysis is used to decide which individual time series are included in the barometers. This involves correlating the individual time series with a reference series.
The reference series used is the year-on-year growth rate of global gross domestic product (GDP), where the individual national GDPs are aggregated at purchasing power parity to form global GDP. A time series is only included in a Barometer if it shows a sufficiently high correlation and a suitable synchronization or lead with the reference series. The time period used for this correlation analysis currently runs from January 2010 to December 2019.
The series of the two Barometers are revised each month at publication and are standardized to have a mean of 100 and a standard deviation of 10 for the 10-year period previous to the most recent observations.
ends
ends